Try the app right here.Log an expense, pay a bill or review a charge, and watch every number update.
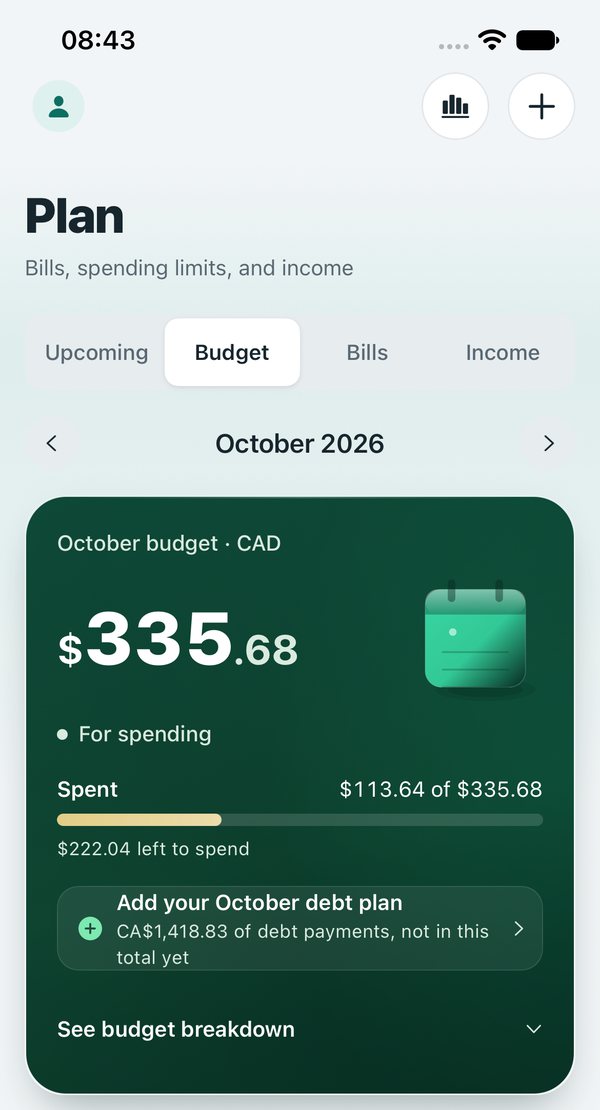
October budget Wed, 7 Oct
Planned2,066.00
Rent, paid−1,250.00
Groceries−118.40
Eating out−46.20
Left651.40
9:41
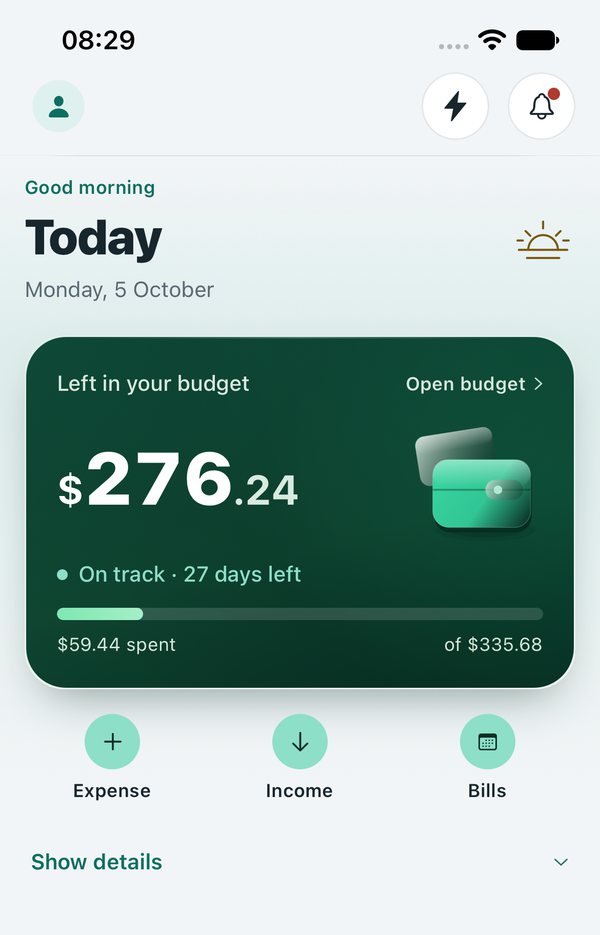
Today
Good morning
Today
Wednesday, 7 October
Left in your budgetOpen budget ›
$651.40
On track · 25 days left
$1,414.60 spentof $2,066.00
Your bank balance isn't your spending money.
Your balance still includes money that's already committed: the phone bill, the card payment, the insurance. Spend from it and the days before payday get tight. ZeusCoffer shows you that gap before you're in it.
The 9 days before paydayExample
Bank shows todayCA$1,840
Oct 9 · Phone−65
Oct 12 · Visa−600
Oct 14 · Insurance, streaming−165
Available until Oct 16 paydayCA$1,010
Bank balanceAvailable to spendCommitted to bills
Your whole month, at a glance.
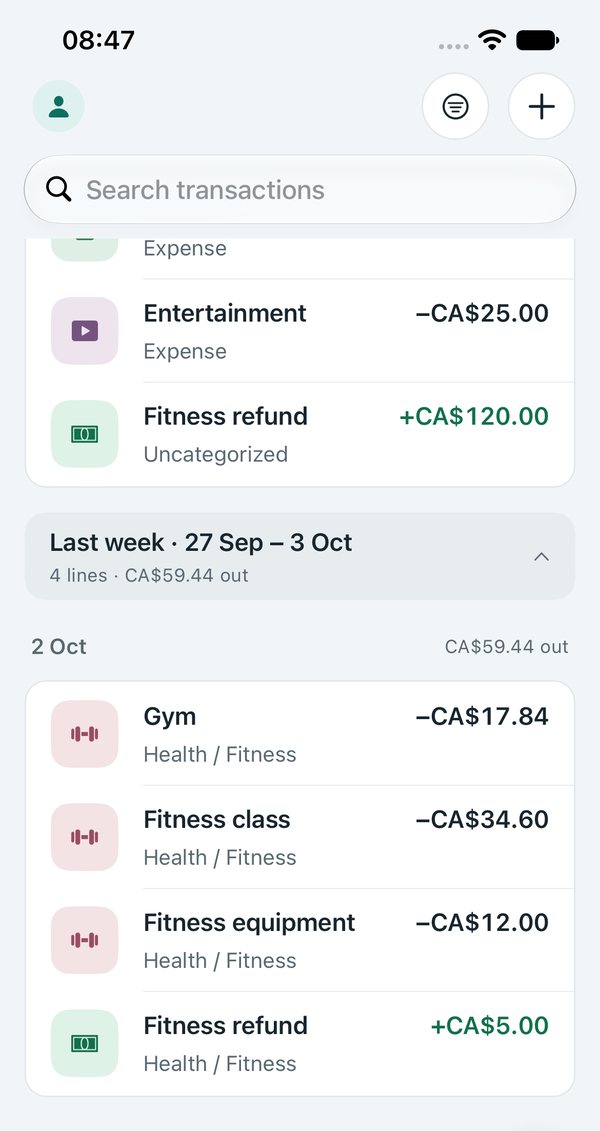
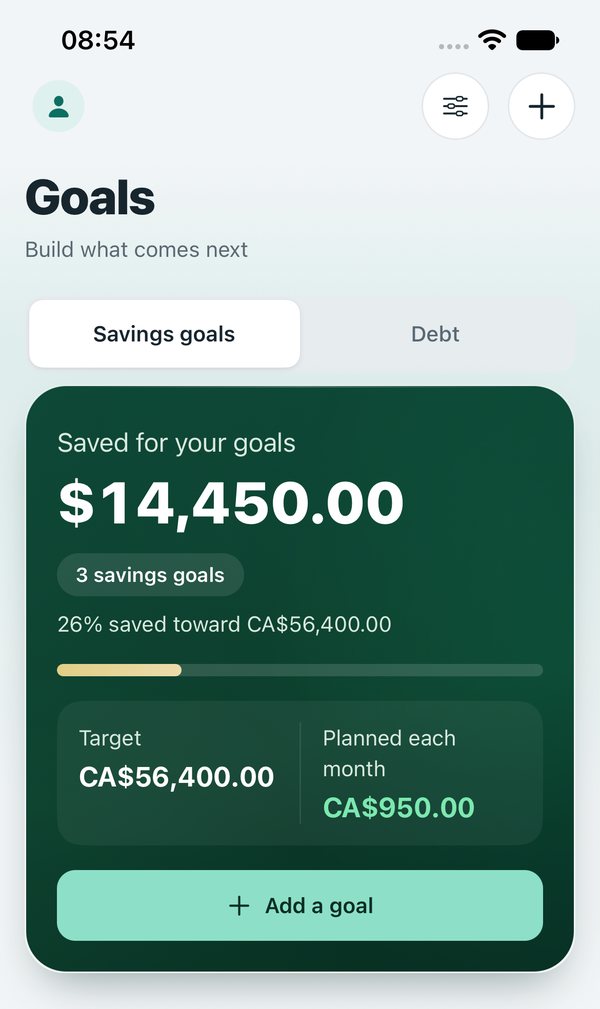
Bills, budget, spending and goals in one place, always up to date. These are real screens from the ZeusCoffer iPhone app, not mockups.
Know where you stand the moment you open the app.
Shown in the Classic theme with sample data. Your information stays on your device, or in your account if you create one.
One plan, from this payday to the next.
Tell ZeusCoffer when you get paid and what's due. Log what you spend, or bring in a statement. It keeps one answer up to date: how much you can safely spend right now.
Give every paycheque a plan.
Your pay, your upcoming bills and what's left over, on one timeline.
Set aside for bills CA$830Available to spend CA$1,010
Available to spend until Oct 16CA$1,010
Catch what slipped through.
Import a statement and ZeusCoffer finds anything you haven't logged. You review each match before it's added.
SQ *CORNER CAFEOct 3 · Coffee?6.45Add
AMZN MKTP CAOct 5 · Already logged24.99Skip
Save with intention.
Set savings goals alongside your budget and track your progress at your own pace.
Emergency fundCA$1,320 of 3,000
Winter tripCA$640 of 2,400
Your bills, found automatically. Your budget, built around them.
Import a few months of statements and ZeusCoffer identifies your recurring charges. Confirm each one and it becomes a scheduled bill and a line in your monthly budget. Everyday categories start from your own spending history.
1Finds recurring charges
Aug statement
AUG 09WIRELESS PLAN 009165.00
AUG 11GROCERY MART 21484.12
Sep statement
SEP 03SQ *CORNER CAFE6.45
SEP 09WIRELESS PLAN 009165.00
Oct statement
OCT 08WIRELESS PLAN 009165.00
OCT 10GROCERY MART 21492.40
The same payee, within 10% of the same amount and three days of the same date, across three or more statements.
2You confirm
Possible bills in your statements
Phone bill
from WIRELESS PLAN 0091
CA$65.00 monthly, around the 9th · in 3 statements
Check and addIsn't a bill
Nothing is added without your approval. Mark a charge as not a bill and it won't be suggested again.
3Builds your budget
October budgetExample
RentBill1,250
Phone billBill · new65
Car insuranceBill148
Music + streamingBill17
Groceries3-month average413
Eating outSpent last month173
Planned for OctoberCA$2,066
Bills go straight into their category. For everyday spending, start from last month, your three-month average or last month's budget.
4Matches each payment
New charge · Oct 9
WIRELESS PLAN 009165.00
Looks like your Phone bill, due today
Link itNot this bill
Phone bill · paid Oct 9
When a payment appears in a statement, a bank alert or an Apple Pay purchase, ZeusCoffer matches it to the bill and marks it paid. Each match teaches it how your bank labels that payee.
Up and running in about a minute.
Five quick steps. Choose what matters to you, pick how you'd like to start, and change anything later.
1Welcome
A calm home for your money.
Setup takes about a minute.
What should we call you? (optional)
2Your focus
What would feel like a win?
Understand my spending
Get ahead of bills
Organize my income
Save for something
3First details
How would you like to start?
Add it myselfType in a balance or a payment.
Bring a statementCSV, OFX or PDF. You check everything first.
No bank connection
4Quick check
You logged a coffee. Now it's on your statement too.
Link to my saved entry
Add it as another expense
Linking keeps one coffee from being counted twice.
5Ready
You're all set.
Bill remindersOn
Pay estimatesOntario
Lock the appFace ID
Open ZeusCoffer
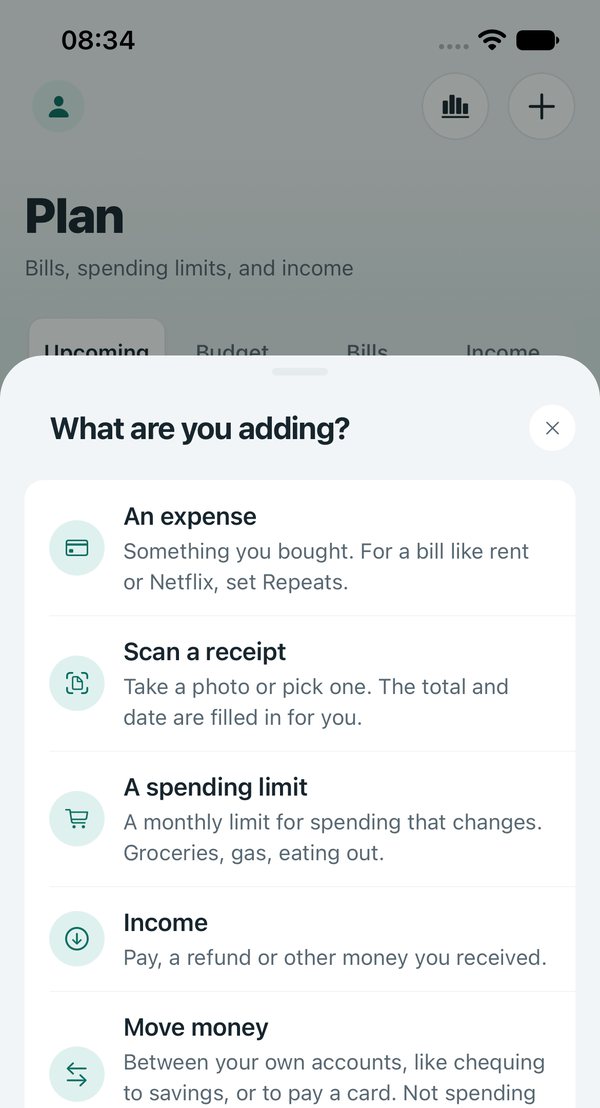
Add spending however suits the moment.
Type itEnter an amount and payee. Categories you've used before fill in automatically.
Import a statementCSVPDFOFXQFX files from your bank's website.
Scan a receiptProcessed on your phone. The photo never leaves it.
Apple PayLog every tap automatically with a Shortcut.
Bank alertsTurn purchase notifications into entries with a Shortcut.
Your bank login stays yours.
Most budgeting apps start by asking for your online banking password. ZeusCoffer works only with what you choose to share, and processes your documents on your device.
Feature
ZeusCoffer
Typical budgeting apps
Your bank login
Never requestedYou decide what goes in
Usually requiredShared with a data aggregator
Statements and receipts
Processed on your deviceFiles are never uploaded
Often processed on company servers
Ads, analytics, data sales
None
Common in free apps
Plans around
Your pay scheduleWeekly, every two weeks, twice a month or monthly
Calendar months
Use without an account
YesYour data stays on your device
Rarely
Pay estimates
Canada and the USProvinces, states, payslips and vacation pay
Rarely includedYou enter what arrives
"Typical budgeting apps" reflects common practice across the category, not any specific product.
Your documents stay on your device.
Statements and receipts are processed on your device. Keep your entries locally, or sync them when you choose to create an account.
october-statement.pdfProcessed on this iPhone. Never uploaded.
No bank connection
Type it, import it or capture it. Your choice.
No ads or tracking
No analytics SDKs. No data brokers.
Face ID lock
Optional, and secured by your iPhone.
Export or delete anytime
Your data, on your terms.
Frequently asked questions.
Everything you need to know before you get started.
Does ZeusCoffer connect to my bank?
No. Enter transactions yourself, import statements from your bank's website, or set up optional Shortcuts for Apple Pay and bank alerts. ZeusCoffer never asks for your online banking credentials.
What do I need to get started?
Your pay schedule and the bills you already know about. A recent statement helps ZeusCoffer find the rest. Setup takes about a minute.
How does it find my bills?
It looks for charges that repeat across at least three statements, at a similar amount and around the same date, and suggests them as bills. Nothing is added until you confirm it.
Where is my data stored?
Without an account, everything stays on your device. With an account, your data is stored on ZeusCoffer's servers so your iPhone and the web stay in sync. Statements and receipts are always processed on your device and never uploaded.
Does ZeusCoffer use AI?
Only if you want it to. Ask Zeus, the optional assistant, stays off until you turn it on. It sees only the names and amounts it needs, never account numbers, documents or sign-in details.
Is it available on iPhone and the web?
The web app is available now, and the iPhone app is coming soon to the App Store. With an account, both stay in sync.
Start with this payday.
Get started on the web today. The iPhone app is coming soon to the App Store.